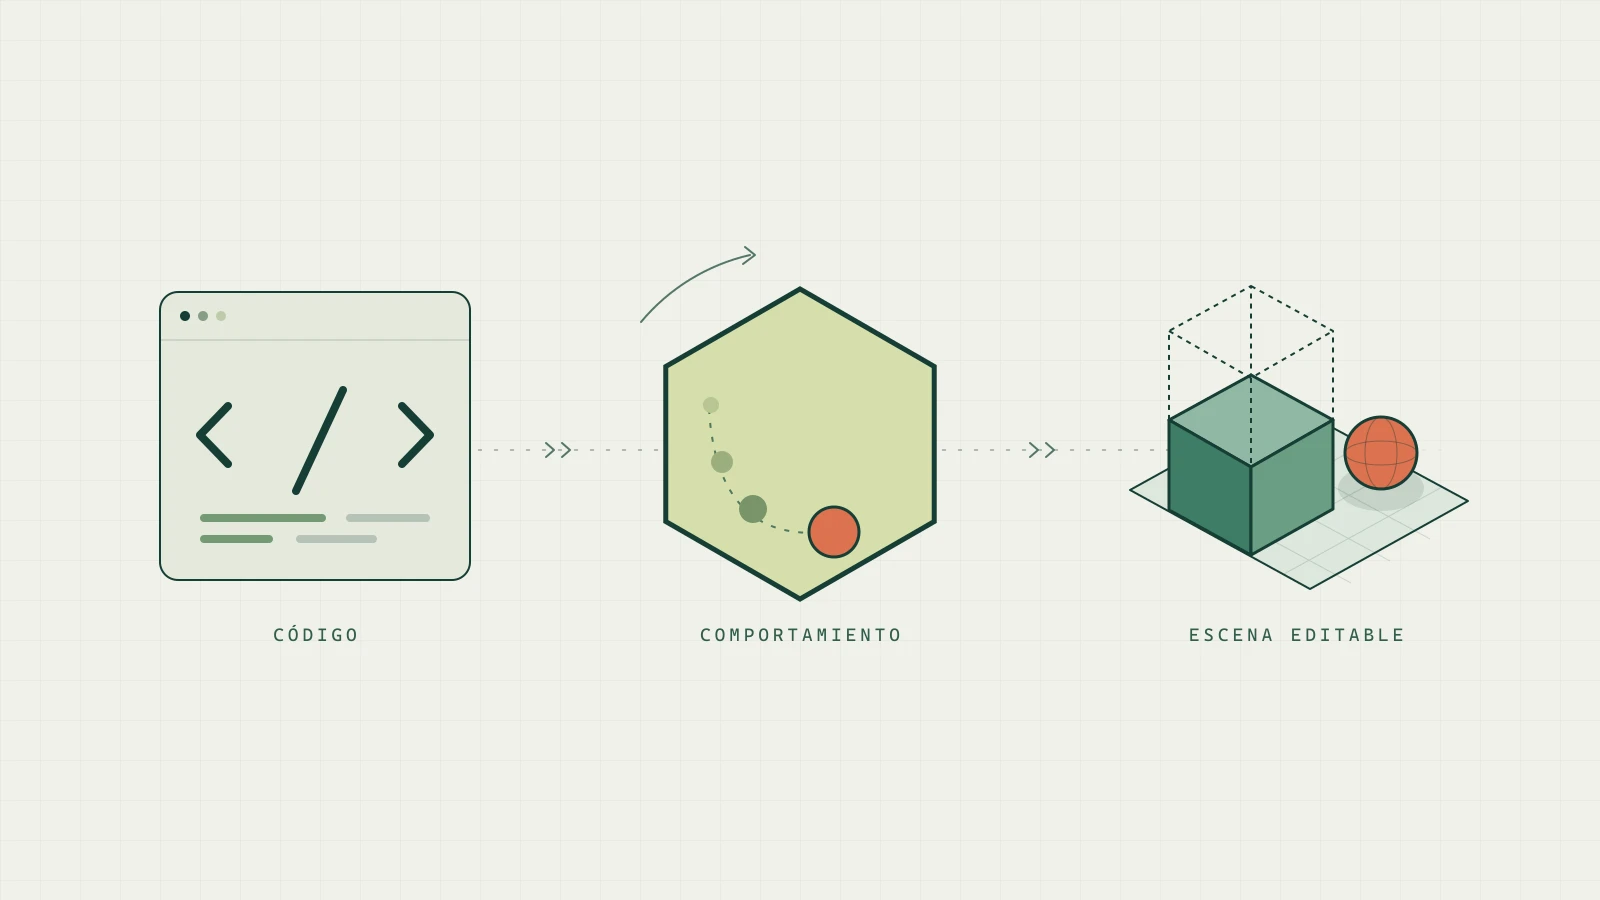
On 22 September 2026, Anthropic released Claude Opus 5.5. According to the announcement, it performs like Claude Fable 5.1 on most work and costs 40 % less to run than Opus 5. Two days later, Carlos Santana, the Spanish science communicator known as DotCSV, published a video that barely stopped at those figures. He was interested in something else: over the previous two months, language models had made a leap in audiovisual creation. Animations, motion graphics, 3D scenes or pixel art made by writing code, without resorting to a video-generation model.
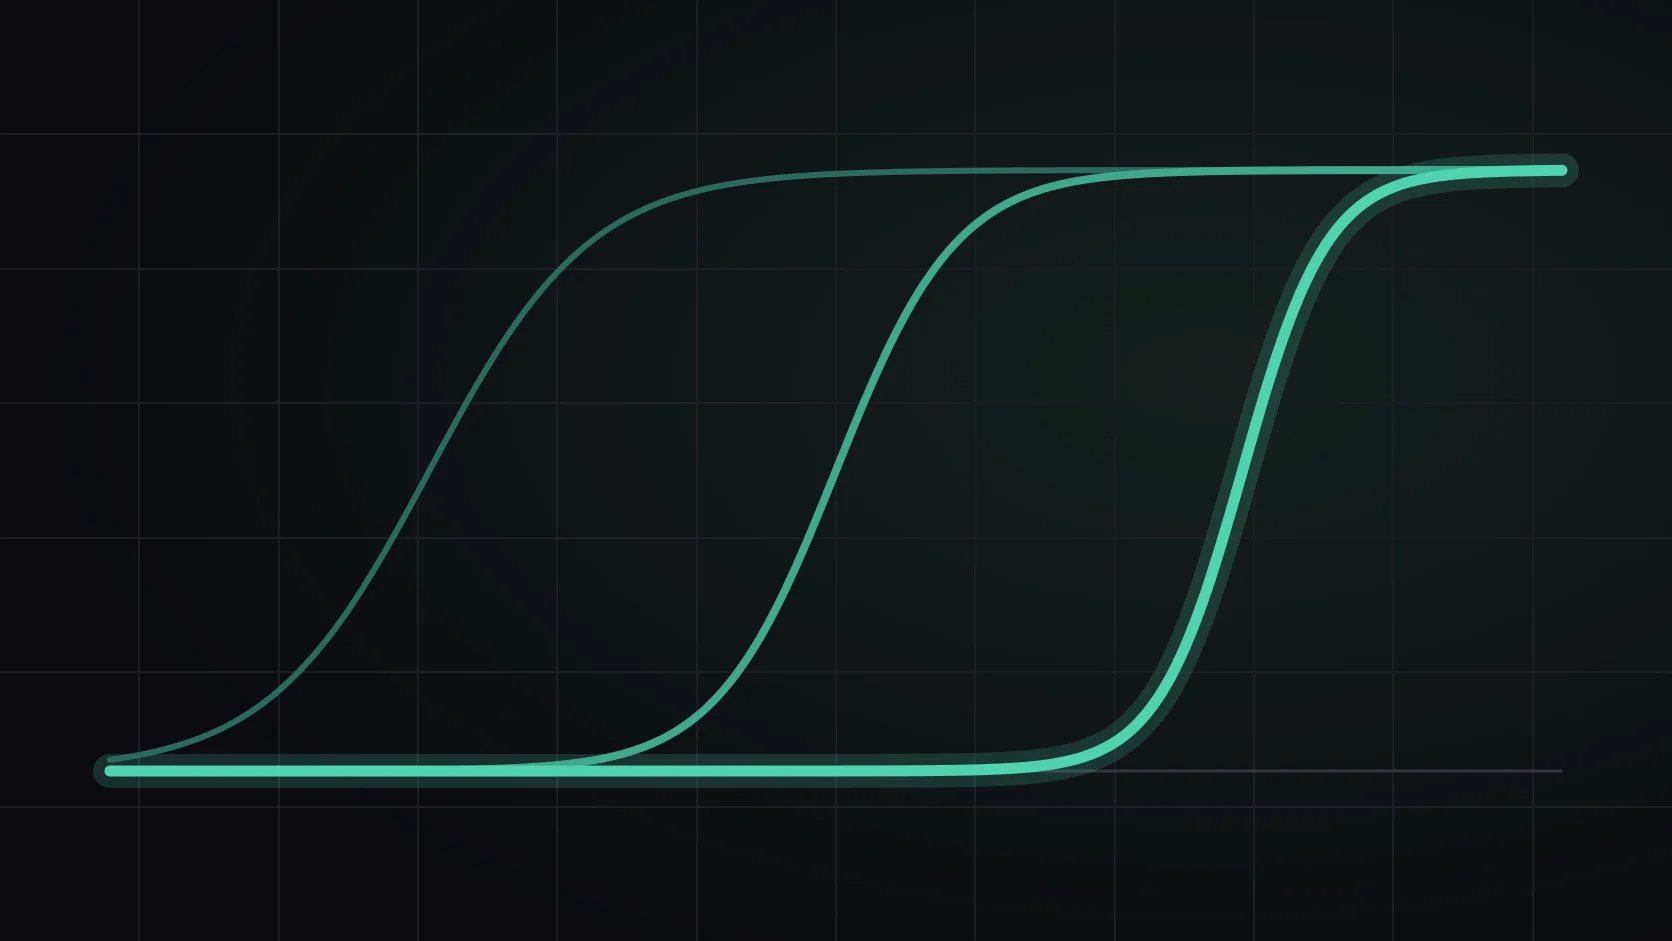
To explain it, he drew a sigmoid: an S-shaped curve that advances slowly, climbs very quickly over a short stretch and ends almost flat. His idea is that each kind of task goes through its own S at a different time. He places the steep stretch for language around the time of GPT-3, the one for programming between 2025 and early 2026, and the one for audiovisual creation in the last few weeks.
The observation matches what many of us have experienced. The interesting part is why it happens. The ingredients used to build models grow fairly steadily: more compute, more data and better methods every year. So where does a stretch come from in which a task goes, within a few months, from “almost never works” to “almost always works”? There is no single cause. There are at least four, and it is worth separating them because each one helps anticipate where the next jump might be.
Capability grows continuously; each task responds with its own curve
First we need to distinguish two things we usually call by the same name: a model’s general capability and its result on a specific task.
Epoch AI, an organisation that tracks AI progress with data, builds its capabilities index on that distinction. It assumes that each model has a general level that cannot be observed directly, and that each test turns it into a score through its own S. Below a certain level, the model gets almost nothing right; above it, it gets almost everything right. Two things change from one test to another: at what level the climb happens, which depends on how hard the test is, and how steep it is. When the curve is very steep, Epoch explains, “a little extra intelligence goes a long way” and the test saturates quickly.
Seen this way, a jump does not require the model to change its nature. It is enough for a capability that grows fairly steadily to reach the climbing stretch of a task. For someone following that task, the change looks sudden. For someone watching general capability, it is one more step in a trend that already existed.
Tests from the last decade show this with data. In the next chart, each line is a capability measured with its own tests: recognising handwriting, images or speech, answering reading-comprehension questions or understanding language. The value −100 corresponds to the first AI result recorded for that test, and 0 to the human reference level.
Recognising handwriting took about twenty years to reach human level. The reading-comprehension and language-understanding tests created between 2016 and 2018 reached it in about two years. Each capability has its own climb, and the more recent ones go through it faster and faster. The chart explains the shape of the phenomenon. The question remains why some curves are so steep.
First cause: a long task is a chain of steps
Many tasks are not a single decision but many chained together. If one error is enough to spoil the result, the probability of finishing well is the reliability of each step multiplied by itself as many times as there are steps.
The figures change a lot with a little. With 90 % accuracy per step, a 10-step task succeeds 35 % of the time, and a 50-step task, 0.5 %. With 99 % per step, those same tasks succeed 90 % and 61 % of the time. Improving the reliability of each step by nine points multiplies the success of the long task by more than a hundred.
The simplification exaggerates the effect: a good system detects some errors and fixes them, which is equivalent to having fewer steps that can ruin the result. But the mechanism exists and has been measured. METR, an organisation that evaluates models, gathers software tasks, from programming to machine-learning research, measures how long expert people take to solve them and checks what task length each model completes half of the time. For a given model, success falls as the task gets longer, following, once again, an S-shaped curve.
According to the update METR published in January 2026, that length doubled roughly every six and a half months between 2019 and 2025, and about every three months since 2024. METR itself warns that the estimate depends on which tasks its collection includes. If the horizon grows steadily, a task of fixed length crosses it at a specific moment: for years it almost never works and, in a short time, it almost always does.
An animation made with code is an extreme case of a chained task. Dozens of elements, timings, transitions and camera movements must fit together at once. One object leaving the frame or one cut out of time is enough to make the result unusable. It is reasonable to expect a task like this to stay near zero while its pieces are not very reliable and to climb quickly once they are. This is an inference from the mechanism, not a result measured for animation.
Second cause: we judge with pass or fail
In 2022, a team from Google and other institutions described emergent abilities: tasks in which small and medium models performed at chance and, beyond a certain size, accuracy shot up. They looked like qualitative leaps that no earlier trend anticipated.
The following year, Schaeffer, Miranda and Koyejo proposed another reading. Many of those tests only accepted the exact answer. To add two four-digit numbers, for example, every digit of the result had to be right. If the model improves little by little on each digit, the full answer keeps failing until all of them are right, and then the result jumps. It is the same effect as the chain of steps. When they evaluated the same answers with gradual measures, which score how close the answer is to the correct one, many of those jumps became smooth.
The debate is not closed. Other work, such as that of Du and co-authors in 2024, argues that some abilities appear when the model crosses a real threshold in its training, not just because it is measured with pass or fail. For our question, one conclusion is enough: the way we measure can turn a gradual improvement into an apparent jump.
And users almost always measure this way. We do not judge an animation by the percentage of correct frames, but by asking whether we can use it. Even if quality improves little by little, what we experience is the day it starts to be useful.
Third cause: labs train what they can verify
What is invested in models grows steadily. Epoch AI estimates that the compute used to train frontier models grew four to five times per year between 2010 and 2024. What changes from one year to the next is which tasks the effort is directed at.
On 12 September 2024, OpenAI introduced o1, a model trained with large-scale reinforcement learning to reason before answering. Reinforcement learning means that the model tries to solve problems and the attempts that work are reinforced. On the 2024 AIME exams, a mathematics test used to select the best high-school students in the United States, GPT-4o solved on average 12 % of the problems; o1, 74 % with a single attempt per problem.
To reinforce what works, you have to know whether it worked. In January 2025, DeepSeek published how it had trained DeepSeek-R1: for mathematics problems, a rule checked whether the final answer was correct; for programming problems, a compiler ran the code against test cases. During that training, its first version went from 15.6 % to 71 % on the same AIME exam.
Programming meets the two conditions that favour an effort like this. The result can be checked automatically, because tests either pass or fail. And there is demand: according to the Anthropic Economic Index of March 2026, coding remains the most common use of Claude, and tasks from computer and mathematical occupations account for 35 % of conversations on Claude.ai.
The programming S can be seen with data. SWE-bench gathers real bugs from open-source Python projects: the model receives the repository and the description of the problem, and must modify the code so that the tests written by its developers pass. In our article on the history of benchmarks we show one of those tasks.
In October 2023, the best model evaluated solved fewer than two in a hundred problems. Within two years, the best published result passed 80 %. The first programming tests asked for a short function written from a precise description. Here the model has to find the bug in someone else’s project, understand its code and change it without breaking anything. The progress coincides with the years in which labs began to train on tasks that can be checked automatically and to give models tools to work as agents: open files, run tests and try again.
Fourth cause: some capabilities are made of others
Audiovisual creation with code is not a single skill. It requires writing code that works and sustaining a long task without losing the thread. It also requires seeing what that code has produced and judging it: whether the rhythm works, whether the composition reads well, whether something is off. It is what we usually call taste or judgement.
A composite capability depends on its weakest link. As long as one of its parts lags behind, the whole keeps failing, even if the others have been improving for a while. When the last one reaches the required level, the whole seems to appear all at once.
Our hypothesis is that audiovisual creation is at that point. Programming and work on long tasks had already gone through much of their S. What seems to have improved in recent months is the visual part: judging what has been generated and using that judgement to correct it. If a model can render a scene, look at the result and fix what does not work, the chain of steps stops breaking at the first error.
It is a hypothesis, but it no longer rests on anecdotes alone. In its technical notes on Opus 5.5, Anthropic lists as a change from Opus 5 a more precise reading of charts, diagrams and screenshots, especially dense charts and images where the position of each element matters. In its announcement, chart reading goes from 83.4% to 89.0%. The same announcement quotes a tester who had several Claude models build a game from a single prompt: Opus 5.5 scored highest on graphics and polish. The rest are demonstrations by science communicators and users, like the ones we collected in our article on viral AI tests, very revealing but without a common method.
A model that sees better does not prove that this is what caused the jump. There are at least three other compatible explanations, and all of them probably play a part. Anthropic presents Opus 5.5 as a model built for long tasks, and an animation is a chain of hundreds of steps: more reliability at each step is enough, on its own, for the chain to start coming out whole. Part of the improvement happens without looking: in the SVG pelican test, the model draws in one go without seeing the result, and the drawings have still been improving for years. And taste can be trained too: if a lab scores the visual polish of what its models generate, their judgement improves even if their eyesight does not.
If the hypothesis is correct, it would also explain why this S arrives after the programming one. Code has tests that pass or fail; taste does not. Labs can use models that assess the result or written criteria to score it, but that check is less reliable than a test. What cannot be checked easily is trained more slowly.
The flat part is not always the end
The last part of the S deserves the same attention as the climb. When a curve flattens, something other than the capability having stopped improving may be going on.
Sometimes the limit is in the test. On 23 February 2026, OpenAI stopped reporting SWE-bench Verified. The best result had barely moved from 74.9 % to 80.9 % in six months. When it reviewed the problems models were not solving, it found that at least 59.4 % of those audited had flawed tests that rejected correct solutions. In addition, frontier models could reproduce some solutions from memory. Part of the plateau was measuring the flaws of the test, not the limit of the capability.
At other times, the limit is in our perception. It already happens with language: models keep improving at writing, but hardly anyone still asks how much a new model has improved at drafting text. The improvements continue; what runs out is our ability to notice them in a conversation.
And, above all, the end of one S is often the beginning of another. It is one thing for an animation to come out well in a demo and another for it to come out well every time, inside a process where nobody checks every frame. Going from 80 % to 99 % is barely noticeable when you look at an example, but it decides whether something can be part of work that is repeated every day. It is the chain of steps again: a fifty-step process with 80 % reliability almost never succeeds; with 99 %, it succeeds six times out of ten.
What to watch to anticipate the next jump
The sigmoid idea does not let us put a date on the jumps, but it does help us ask better questions. Instead of asking when AI will reach a task, it is worth looking at four things:
- How many steps the task is made of and how reliable each one is. Long tasks lag behind for longer and then climb faster.
- How we decide whether it worked. If it is judged as pass or fail, the improvement will be felt all at once.
- Whether the result can be checked automatically. What can be verified can be trained at scale, and that is where effort will be directed first.
- Which piece is missing. In a composite capability, the weakest part sets the moment of the jump.
What is happening with audiovisual creation fits that pattern: a long task, judged by whether it is usable or not, built on capabilities that were already reliable and that was missing the eye. The next S curves will probably appear in tasks with that combination. And each time one reaches its flat part, the question that matters most when using AI in real work will begin: not whether it can do it, but whether it always does it well.
Sources
- DotCSV Lab: “CLAUDE OPUS 5.5 es TODA UNA REVOLUCIÓN AUDIOVISUAL (…sorry Astra)”, 24 September 2026 (in Spanish)
- Anthropic: Introducing Claude Opus 5.5, 22 September 2026
- Anthropic: What’s new in Claude Opus 5.5, documentation
- Epoch AI: Epoch Capabilities Index
- Epoch AI: Training compute of frontier AI models grows by 4-5x per year
- Our World in Data: Test scores of AI systems on various capabilities relative to human performance
- Contextual AI: Plotting Progress in AI
- METR: Measuring AI Ability to Complete Long Tasks, 2025
- METR: Time Horizon 1.1, January 2026
- Wei et al.: Emergent Abilities of Large Language Models, 2022
- Schaeffer, Miranda and Koyejo: Are Emergent Abilities of Large Language Models a Mirage?, 2023
- Du et al.: Understanding Emergent Abilities of Language Models from the Loss Perspective, 2024
- OpenAI: Learning to reason with LLMs, 12 September 2024
- DeepSeek-AI: DeepSeek-R1, January 2025
- Anthropic Economic Index, March 2026
- Jimenez et al.: SWE-bench, October 2023
- OpenAI: Introducing SWE-bench Verified, August 2024
- Anthropic: Claude 3.5 Sonnet on SWE-bench
- Anthropic: Claude 3.7 Sonnet, 24 February 2025
- Anthropic: Claude Opus 4.5, 24 November 2025
- OpenAI: Why SWE-bench Verified no longer measures frontier coding capabilities, 23 February 2026